

Mixed messages
The Cape index is back above $50,000 mark, and sentiment for the coming months remains bullish. But in stark contrast, the traditional drivers of Capesize demand appear to be cooling off.
By Nick Ristic
Defying gravity
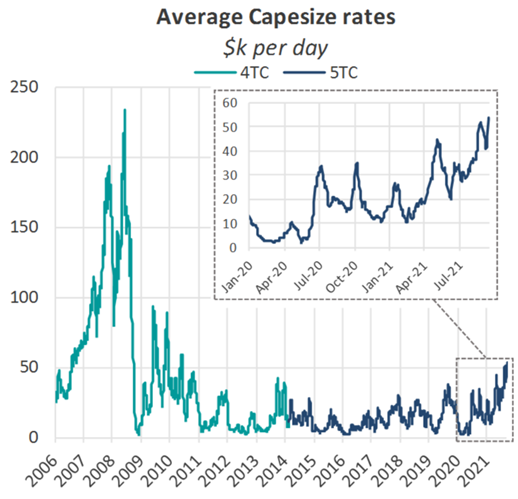
This week, average Capesize rates hit a fresh milestone, soaring again past the $50,000 mark to a high of $53,692 per day. This figure is almost three times higher than average rates over the past decade and marks the highest level of earnings since June 2010.
Over the last couple of weeks, both basins have tightened, as the ramp up in shipments from Brazil coincides with a severe shortage of vessels in the Pacific, owing to several factors. One of these is the elevated congestion levels we have recorded in Chinese ports. Cape queues in China stood at 19.1m dwt at the start of this week, which is down by 22% from their August peak, but the figure still represents about 5.3% of the trading Cape fleet. Typhoon Chanthu, which passed over the Shanghai region this week has likely exacerbated these issues, with several ports halting operations temporarily. As vessels depart anchorages ahead of the severe weather, it’s tough to gauge exactly how high the congestion figure is today, but the additional waiting time will likely translate to heavier congestion. At the same time, COVID-related bottlenecks are still affecting ports in this region and others, tying up ships for longer.
Coal is also supporting the fleet, as a global energy squeeze sends prices of the commodity to 13-year highs. Supply is especially tight in China, where mining capacity has struggled to close the gap left by the ban on Australian supply, and Indian demand is also now picking up as industrial activity gets back on track. As we wrote a few weeks ago, the shake-ups to regular trading patterns have meant that average Capesize employment generated per tonne of coal shipped this year has increased by 16% compared to the last five years. As such, Cape employment from Coal has hit record levels in Q3, despite total trade volumes remaining below pre-pandemic levels.
And as we have also covered previously, underlying the Cape market we still have the effects of Australia’s 14-day quarantine requirements, which have the effect of extending the ballast leg of a typical C5 (Australia - China) voyage. All of these effects have helped to push Capesize utilisation close to levels we have seen on the geared ships so far this year. Once at these levels, the market becomes extremely sensitive to small changes in the balance of cargoes and tonnage, and volatility becomes even more extreme.
Great expectations
The FFA market has also been extremely hot and equally sensitive to these changes, though the ongoing surge in freight appears to have been priced into the forward curve for several weeks. The September contract, for example, is currently trading around where it was about a month ago.
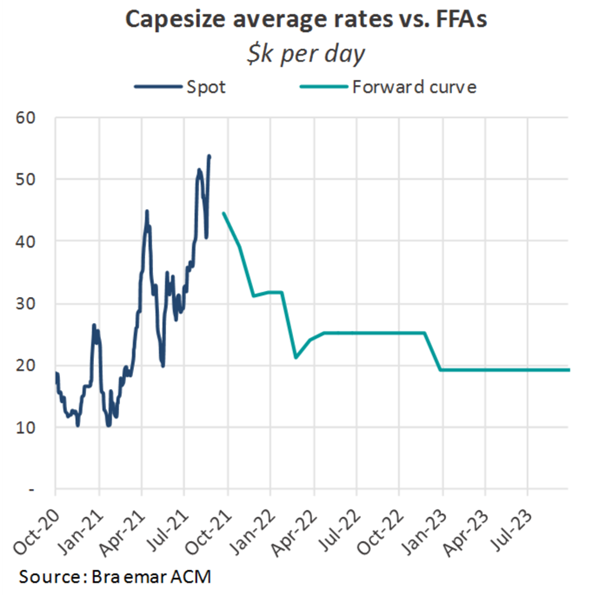
There has however been a significant movement in futures for Q1 2022, which are currently trading 32% higher than they were at the mid-point of 2021, as the market reassess the likelihood of the current dry bulk rally rolling into next year. Meanwhile calendar-year 2022 contracts have soared above $25,000, almost double where they were trading at the start of the year.
Worrying signs
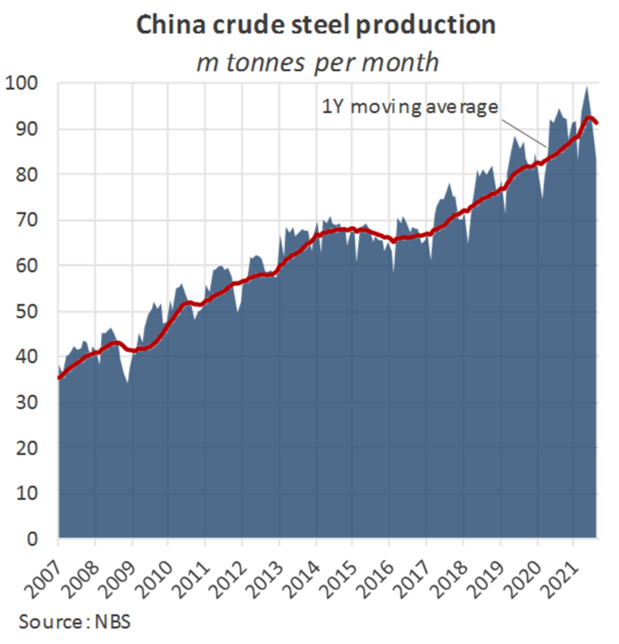
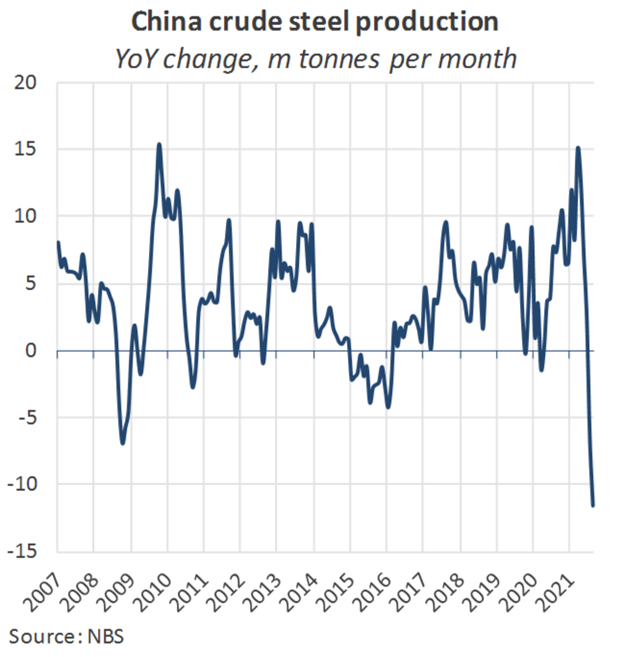
Amid this frenzy, we are at the same time receiving alarming signals from China, which is by far the most important driver of the dry market. Yesterday we learned that steel output dropped by more than 12% YoY in August to 83.2m tonnes, the greatest YoY slump in percentage terms since the Global Financial Crisis. Over the first half of the year, authorities failed to meet targets of flat output levels relative to 2020, but over the last couple of months capacity cuts have been far more aggressive than we expected. In absolute terms, August’s YoY drop of 11.6m tonnes marked the greatest ever.
Iron ore prices have also nearly halved, since May. Benchmark 62% Fe ore sunk below $120 per tonne yesterday, the lowest since October last year. Economic markers such as industrial output, infrastructure investment, retail sales and floor space under construction also registered the slowest levels of growth since the pandemic hit China in early 2020. All of these have also raised question marks over China’s long-term dry bulk demand prospects.
Steel prices, however, have not mirrored collapse in iron ore, partly because output has been constrained so heavily, but also because underlying demand still appears firm. As such, its extremely difficult to gauge how long a politically-motivated cut can be sustained before mills manage to crank up output to take advantage of elevated prices.
Looking forward, in the short term, we expect COVID-related factors, continued tightness in the coal market and a continued recovery in Brazilian iron ore exports to keep rates strong. However the apparent slowdown in China’s economy, along with instability in the property markets, present a significant risk for the longer term. Over the coming weeks we’ll be incorporating this new data to reassess how we see rates shaping up for next year.