By Nick Ristic
The Capes
As the year draws to a close, we review the wild ride that has been the Cape market in 2021. We’ve seen multi-year highs for freight and commodity prices, and with 2022 looming, the market remains on good, albeit volatile, footing.
Ramping up
2021 started with an unseasonable jump in Cape rates in January, boosted by a surge in congestion in the Far East (a recurring theme this year). This was driven by extreme weather in key discharge ports, residual queues from China’s ban on Australian coal and the COVID-related delays to port operations that we have now become accustomed to.
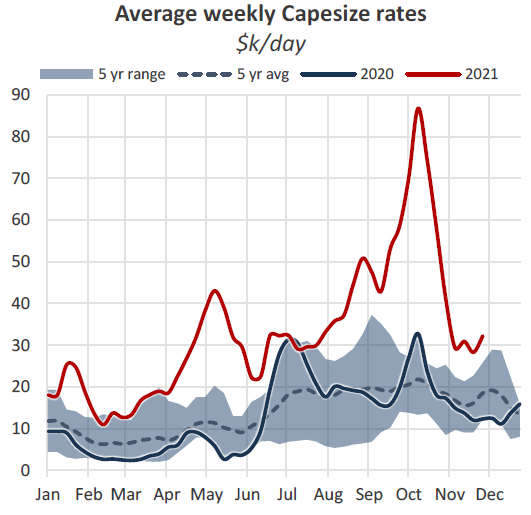
However this was just a taste of things to come. The market built up to a ten-year high of $44,817 in May, as we wrote that sentiment was approaching ‘good old days’ territory, with the continued disruption to coal trade flows tightening the market further. These trade distortions were compounded by a critical shortage of coal in several regions, an issue which persists today.
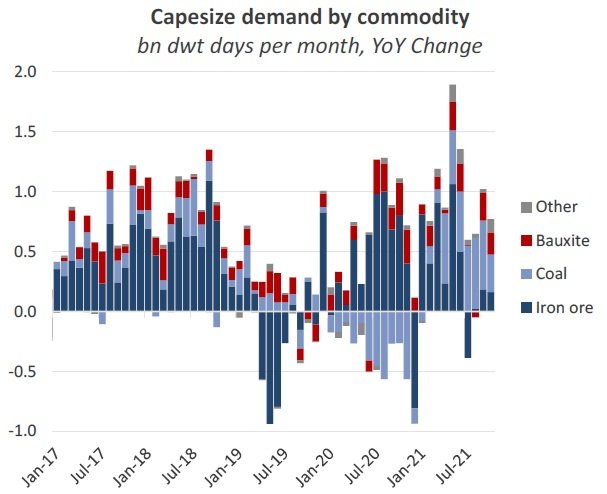
Growth in Cape demand from coal, driven by these factors, has surprised us this year. Although we had expected 2020’s 14% slump in coal employment to eventually reverse back to pre-pandemic levels, we didn’t see it happening as quick as it did this year. Over the first ten months of 2021, Capesize coal employment has surpassed that over the same period in 2019 by more than 5%. Coal has also accounted for 40% of Cape demand growth so far this year, compared to just 16% in 2018 (the most recent ‘normal’ year with no black swan events).
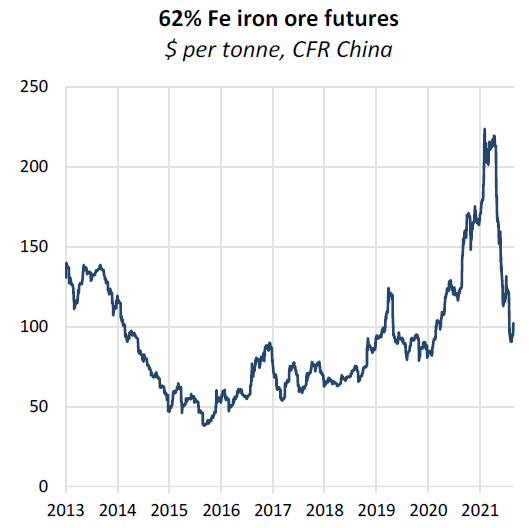
On the flip side, Cape demand from the iron ore trades was relatively muted during this 1H 2021 rally. Shipped volumes grew by a modest 2% YoY over January - June, but demand for the commodity vastly outstripped the supply available. Alongside the spike in Cape rates, iron ore led a blistering rally all-time highs of over $232 per tonne in May. Over this period, extreme growth in Chinese steel output seemed unstoppable, with production over the first five months of the year soaring by 13% YoY and hitting just shy of 100m tonnes per month in May.
The ferrous market fundamentals were however rocked a few weeks later as Chinese economic planners appeared to take steps to curb steel output and meet the previously-stated goal of keeping 2021’s production flat versus 2020. Since May, we have seen some of the greatest ever falls in output. By October, monthly production had fallen by 28% from May’s levels and 22% YoY to 71.6m tonnes. Despite this sharp change of tack for Chinese steel, the party was far from over for the Capes. Iron ore reversed into a bear market, shedding as much as 60% of value in the months that followed, but Chinese buyers capitalised on lower prices (which were still well above the major producers’ unit costs) to replenish depleted stockpiles, keeping volumes from Australian shippers particularly strong.
This set the stage for the highlight of this year: the scorching bull-run that sent average Cape rates just shy of $87,000 in Q3, the highest levels seen since 2009. Congestion in China became an even greater driving force of the market, with queues jumping to record levels which translated to over 5% of the trading fleet, with other factors such as Australia’s fourteen-day quarantine requirement and deviations for crew changes layering on additional inefficiencies. China’s intensified scramble for coal added to the heat, and with utilisation rates already at extremely high levels, rates pushed into exponential territory, brushing off the brewing concerns over China’s property sector and long-term economic growth prospects. The spike, however, had to correct eventually, and October saw rates slide back to ‘normal’ levels, losing about $60,000 in the space of a month. The freight derivatives market saw a similarly savage sell off in October, for both near-term and deferred contracts. December FFAs had plunged by 64% by mid-November, but have since reclaimed about half of this loss to trade at $34,875 at the time of writing. Calendar-year 2022 contracts dropped by 40% to a low of $18,000 and have since climbed back up to $22,750.
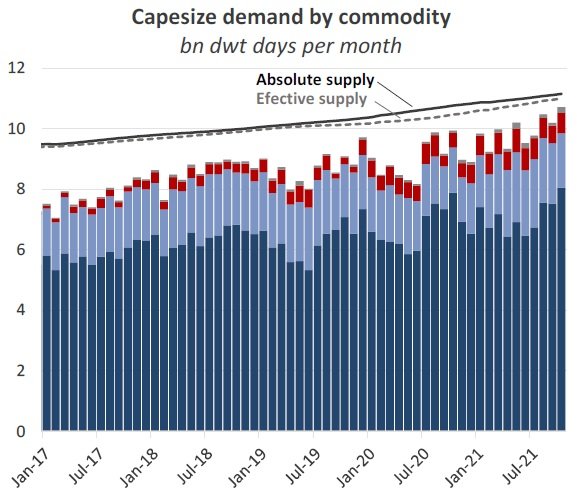
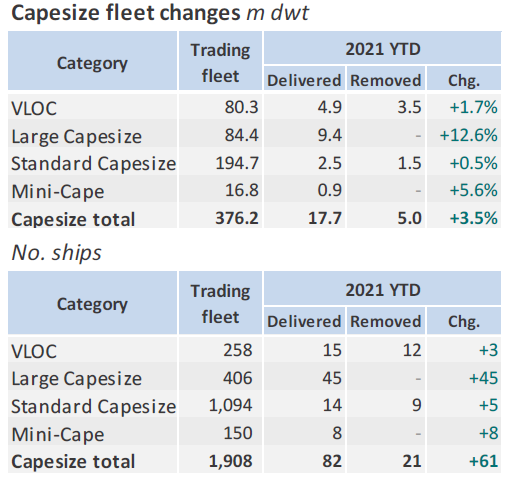
On the supply side, 2021 has so far seen 81 new ships join the Cape fleet, though within this, additions have focused heavily in the Newcastlemax segment. 21 vessels have been removed, but in dwt terms, 70% of this capacity has been old VLOCs built in the early 90s. The remaining 1.5m dwt removed was made up of sub-180k dwt designs with an average age of 22.5 years at demolition. The net effect of these changes has been a 3.5% YTD increase in Capesize capacity, the highest of all of the bulk carrier segments.
Where do we stand?
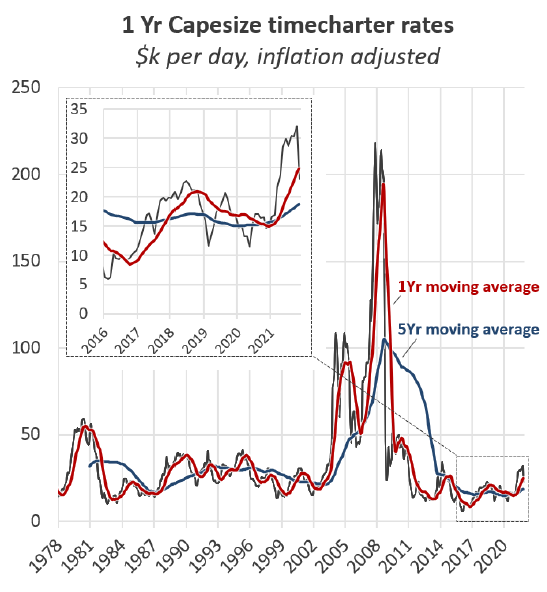
Although rates are still well below Q3’s levels, they remain extremely firm. Today’s Capesize index printed at $37,604, which, excluding this year, is not far off the strongest levels we’ve seen since 2013. Looking forward, we remain fairly conservative on the growth prospects of coal trade and Chinese iron ore demand, but expect that a historically low delivery schedule will provide a floor to rates. As such, even though we think 2022 will average lower than this year, we believe the long-term underlying freight cycle (indicated by the 5-year moving average in the chart below) is trending upwards and the days of heavy oversupply are behind us.