
by Nick Ristic
Age is just a number?
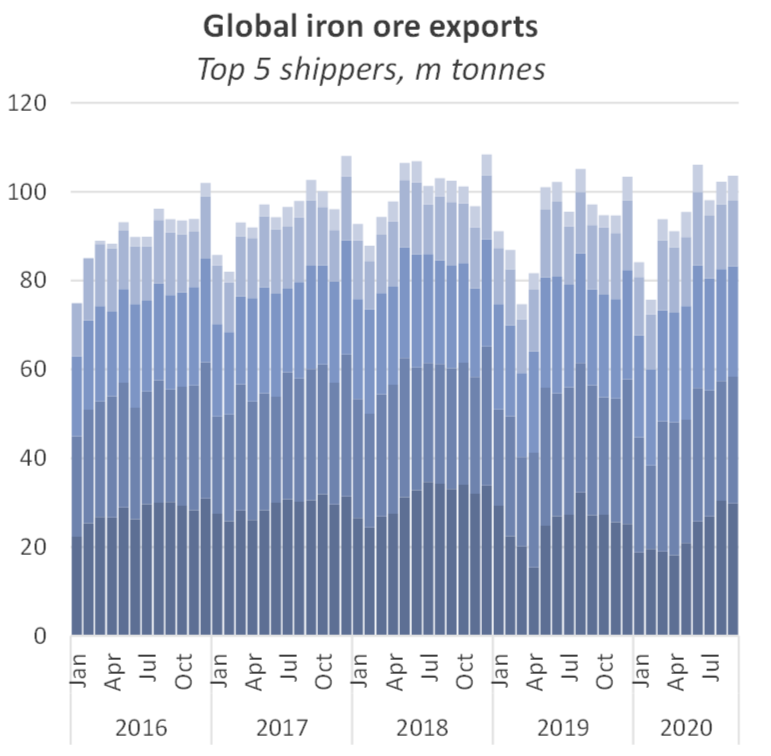
Using our AIS tracking of iron ore trade and our extensive fleet database we can plot how vessel requirements vary by shipper and identify broader strategies being employed in the iron ore market. Focusing on ore shipped by the top producers in Australia and Brazil (Vale, Rio Tinto, BHP, FMG and Roy Hill), which accounted for more than two thirds of global iron ore trade in 2019, a few features stand out.
The first of these is the relatively young fleet that these companies employ. Around 48% of today’s Cape fleet is aged 10 years or older, but in contrast just under 80% of vessels employed by most of the major shippers so far this year have been under the age of 10 years. The median age of the Capesize fleet is around 10 years, but those hauling ore for these producers have a median age of around 7.5 years.

Most of these companies are publicly listed and over the past few years they have all placed a greater emphasis on utilising ships which are more efficient and offer lower carbon dioxide emissions. For example, some utilize the RightShip Greenhouse Gas (GHG) rating system, which gives preference to vessels with a better fuel economy. This in part drives their disproportionate use of modern ships.
For Brazil’s exports, we’ve seen a dramatic change in the age profile of ships used. In 2015, across shipments from all Brazilian iron ore charterers, 20% of voyages were made on vessels over 14 years old, while so far this year, only around 9% of liftings have been made on ships this old. Meanwhile 80% of shipments in 2020 to date have used vessels under the age of 10.5.

Dedicated fleets
The shift in the age profile used by Brazilian shippers is also a reflection of the dedicated ships used in this trade. Since the start of the year we’ve seen the majority of the old converted Very Large Ore Carriers (VLOCs), that were previously used on this route, leave the trading fleet. These units were converted from single-hull tankers around 2010, but were built in the early 90s. Over the last few months we’ve seen this fleet renewed with the newest generation of VLOCs.
So far in 2020 we have counted 22 of these veteran ships removed from the fleet, while 17 new VLOCs have delivered, though, given the size differences of these designs, the VLOC fleet has shrunk by less than 1% in dwt terms.
These ships are key to the strategy of producers in Brazil, maximizing economies of scale and enhancing competitiveness on freight, relative to Australian suppliers, which are much nearer to the market in East Asia. Since the start of 2018, the carrying capacity of VLOCs dedicated to Brazilian trade has grown by 89%. And we expect this sub-sector of the fleet to grow by a further 9% by the start of 2022, even after accounting for the removal of all of the converted ships. So far this year 64% of Capesize volumes (all vessels Mini-Cape size and above) shipped by Vale from Brazil have been carried by VLOCs, versus 56% in 2015.
With a growing portion of the Brazil - Far East trade being done on a CFR basis, we have seen significant effects in the spot market. Supply disruptions over the past couple of years have hit total volumes from South America, but looking at the vessels employed in the trade, those in the spot market appear to be disproportionately affected.
Contracted tonnage is always used by charterers as efficiently as possible, so these vessels tend to be first to load when volumes start to recover from temporary supply issues. And when volumes correct to normal levels, we see a disproportionate positive effect on volumes loaded onto non-dedicated ships.
Over Q1 this year, total iron ore liftings from Brazil fell by 25% QoQ. However volumes on VLOCs only fell by around 20%, while shipments on all other vessel sizes dropped by around 30%, hitting spot rates. But a few months later, total shipments during Q3 grew by 24% QoQ. Volumes on VLOCs only increased by 3% while those on other ship types jumped by 48% and we saw a sharp correction in rates. While we haven’t seen this feature necessarily impact rates over a long time period, it does seem to be driving elevated volatility in the Cape market. 2020 so far has been the most volatile year on record for dry bulk rates.
Selling FOB in Asia
We also see many of these charterers gaining a competitive edge and becoming more flexible in other ways. Vale has operated the Teluk Rubiah transhipment facility in Malaysia since 2014, where ore is discharged from VLOCs and then loaded onto Capes in the spot market. By bridging much of the distance between mine and customer with contracted tonnage, and selling ore FOB in Malaysia, end users can be supplied with a much shorter lead-time.
But more recently Vale and others have begun selling ore from blending facilities in China, in ports such as Dalian, Yantai, becoming even closer to the market. It’s tough to gauge these volumes exactly, but we’ve seen Capesize liftings from these hubs to nearby countries such as Japan, South Korea and Vietnam gradually pick up since 2017. These Cape shipments increased by 70% YoY last year to almost 6m tonnes, and are on track to settle at around 5.7m tonnes this year. This is on top of about 6.2m tonnes of Panamax iron ore cargoes from Chinese berths to other countries.

Margin over volume
With demand growth in the iron ore market slowing over the past few years, many of the majors are no longer focusing on large capacity increases and market share. These companies now seem to be concentrating on growing profits through efficiency (partly though the aforementioned methods) and producing higher quality products.
A recurring theme in these companies’ production reports is a reluctance to oversupply the market with material and squash iron ore prices, and this has been reflected in shipped volumes. On a quarterly average basis, shipments during 2019 and 2020 so far have remained virtually flat on 2017’s average, and are only 3.5% higher than over 2016.
While we see some growth in capacity from these producers in the pipeline, we expect it to be limited relative to previous years and production guidance for the coming year is somewhat lacklustre. Going forward, we expect the majority of demand growth to come from smaller producers and other commodities.